Overviews
An overview is a rich-text area in the left-hand sidebar. It’s designed for information that should be visible wherever you are on the canvas, like a guide, summary, or checklist.
#Why use an Overview?
Overviews are helpful for:
- Explaining the purpose of a canvas or framing your analysis.
- Adding introductions, instructions, or notes for collaborators.
- Adding contact details of the canvas creator.
- Creating a shared to-do list for development.
- Centralising control cells so filters are always accessible.
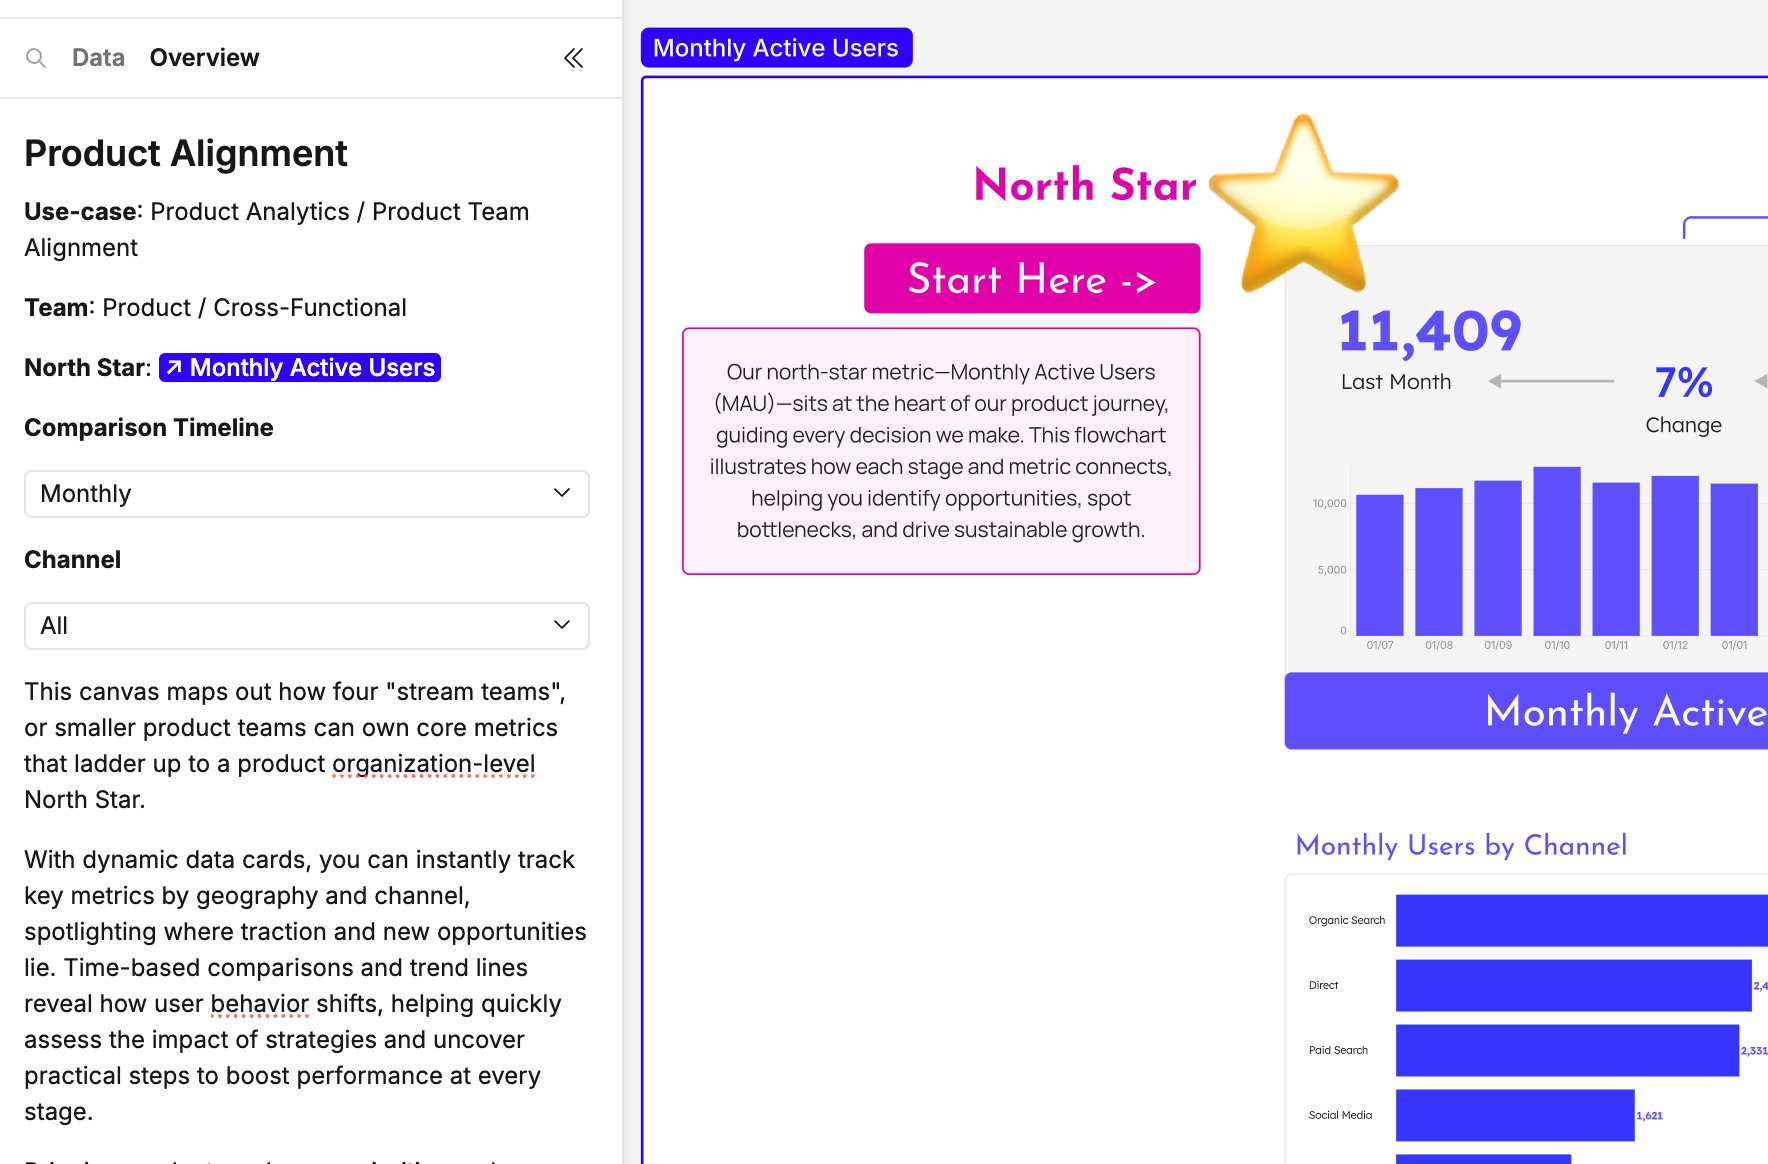
#Using overviews
#Adding content
- Start typing paragraph text directly.
- Type
/to add rich-text components such as headings, blockquotes or code blocks. You can also select a control cell on the canvas to make it usable in the Overview. - Use Markdown syntax (the same as text cells) for formatting.
- Type
@to:- Mention a user (users will receive an email notification, unless they’ve disabled notifications in their user settings).
- Link to a frame or cell (clicking zooms the viewport to it).
- Frame links adopt the stroke colour of the frame, which can help with navigation when there are many sections.
#Managing content
- Reorder items → Use the drag handle on the left of each element to move it up or down.
- Delete items → Place your cursor at the end of the item and press Backspace. This removes that component from the Overview.
#Quick-start options
If the Overview is empty, you’ll see shortcuts to add:
- Filters → Adds copies of all canvas control cells to the overview. Note, these will cease to function if the control cells are deleted from the canvas.
- Canvas guide (AI beta) → An AI-generated summary of your canvas with suggested frame/cell explanations.
- Table of contents → A nested, clickable list of frames and cells for fast navigation.
- To-do list → A ready-to-use checklist template.
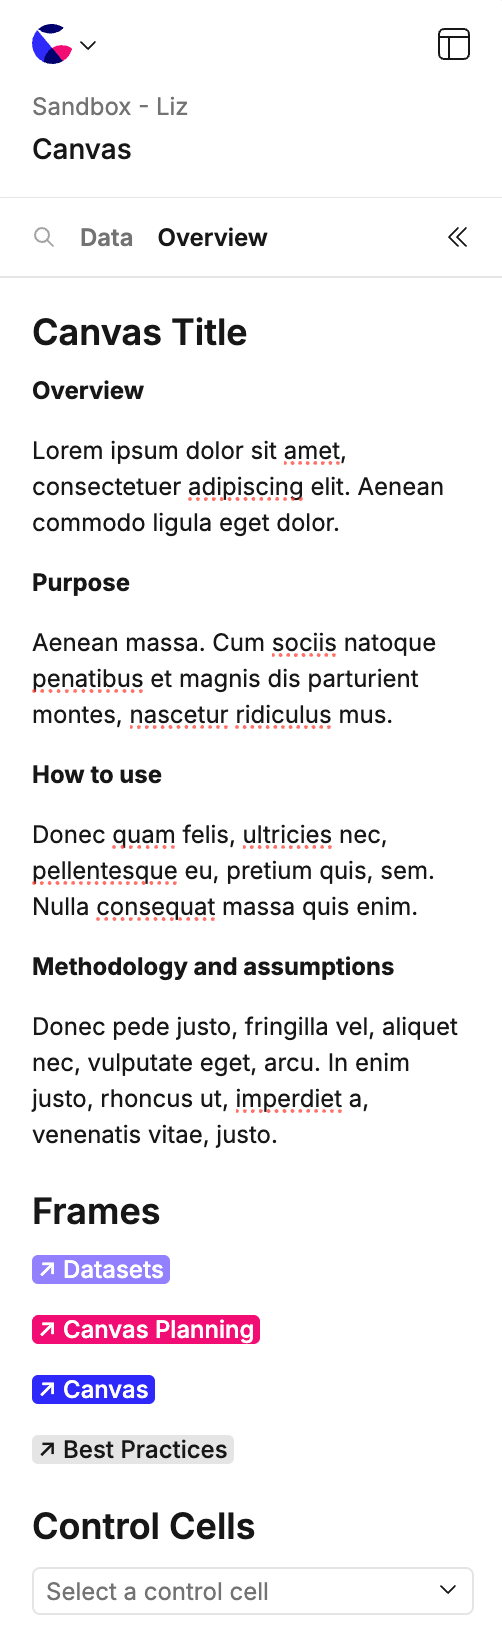
#Overview example
It's up to you what you would like to include in your Overview pane, however if you need, we've outlined some sections to get you started:
- Canvas title -> The title of your canvas.
- Overview -> A summary of the canvas.
- Purpose -> What does your canvas do and achieve.
- How to use -> Help to navigate your canvas.
- Methodology and assumptions -> Any data nuances to be aware of.
- Frames -> Link your frames using '@' for fast access.
- Control cells -> Add your control cells in using '/'.
- Canvas log -> Log your name, job title and date of creation to start an audit trial for accountability and so users know who to ask questions to.
#Controlling visibility
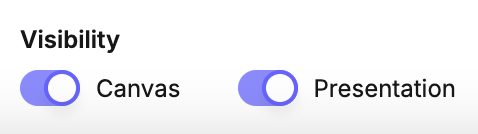
At the bottom of the Overview you’ll find two toggles:
- Canvas visibility → When on, the Overview opens by default instead of the Data tab.
- Presentation visibility → When on, the Overview appears in Presentation mode.
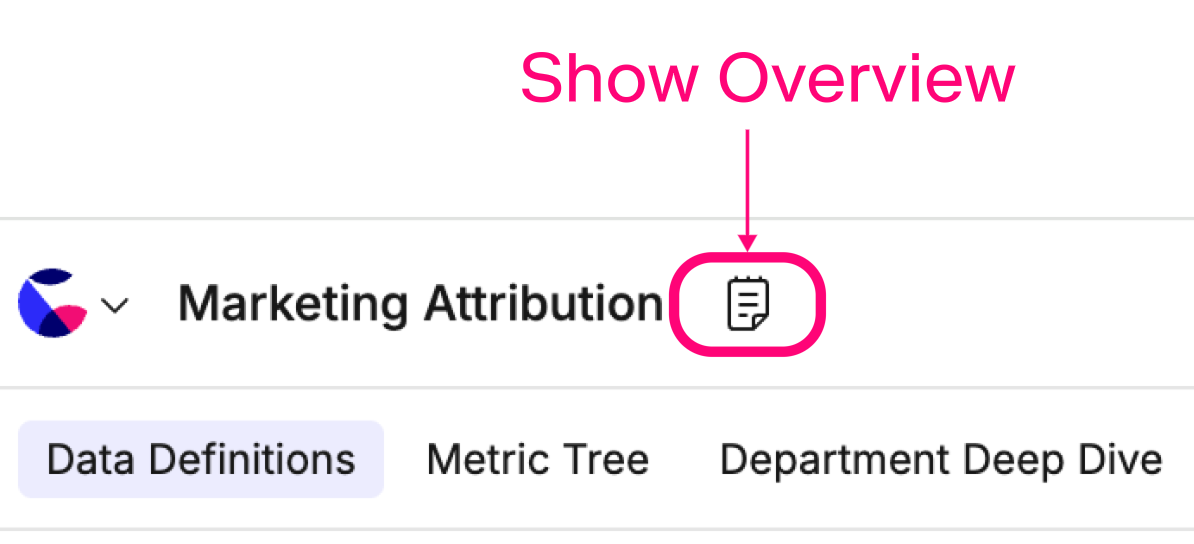
You can also show or hide the Overview panel:
- Panel toggle – Use the arrows icon at the top of the sidebar to show or hide the Overview panel while working in the canvas.
- Presentation toggle – In Present view, use the Overview button in the toolbar to show the panel (and the
Xto hide it).
Last updated: 03/08/26