Learn
Search…
Sign up
Start Here
Data Sources
Working in The Canvas
Build Trusted Context
Integrating Count
Managing Your Workspace
Analytics Engine
Count's compute layer
Cells overview
Visual and low-code cells
Visualization overview
Templated visuals
Custom visuals
Formatting a visual
Tooltips
Secondary axis
Layout and sizing
Axes
Legends
Title
Style
Label
Filter data in a visual
Totals and subtotals
Logic options
Display options
Color, size, opacity & dash
Column summaries
Tables
Maps
Dynamic text
Visualization tips
Calculations In Visuals And Low Code Cells
Joins In Visuals And Low Code Cells
Visual recipes for the agent
SQL cells
Control Cells
Python cells
Legacy Python cells
Import SQL files
Referencing other cells
SQL formatting
Jinja templating
Troubleshooting & FAQs
Analytics Engine
Analytics Engine
/
Cells overview
/
Visual and low-code cells
/
Formatting a visual
/
Secondary axis
Secondary axis
#
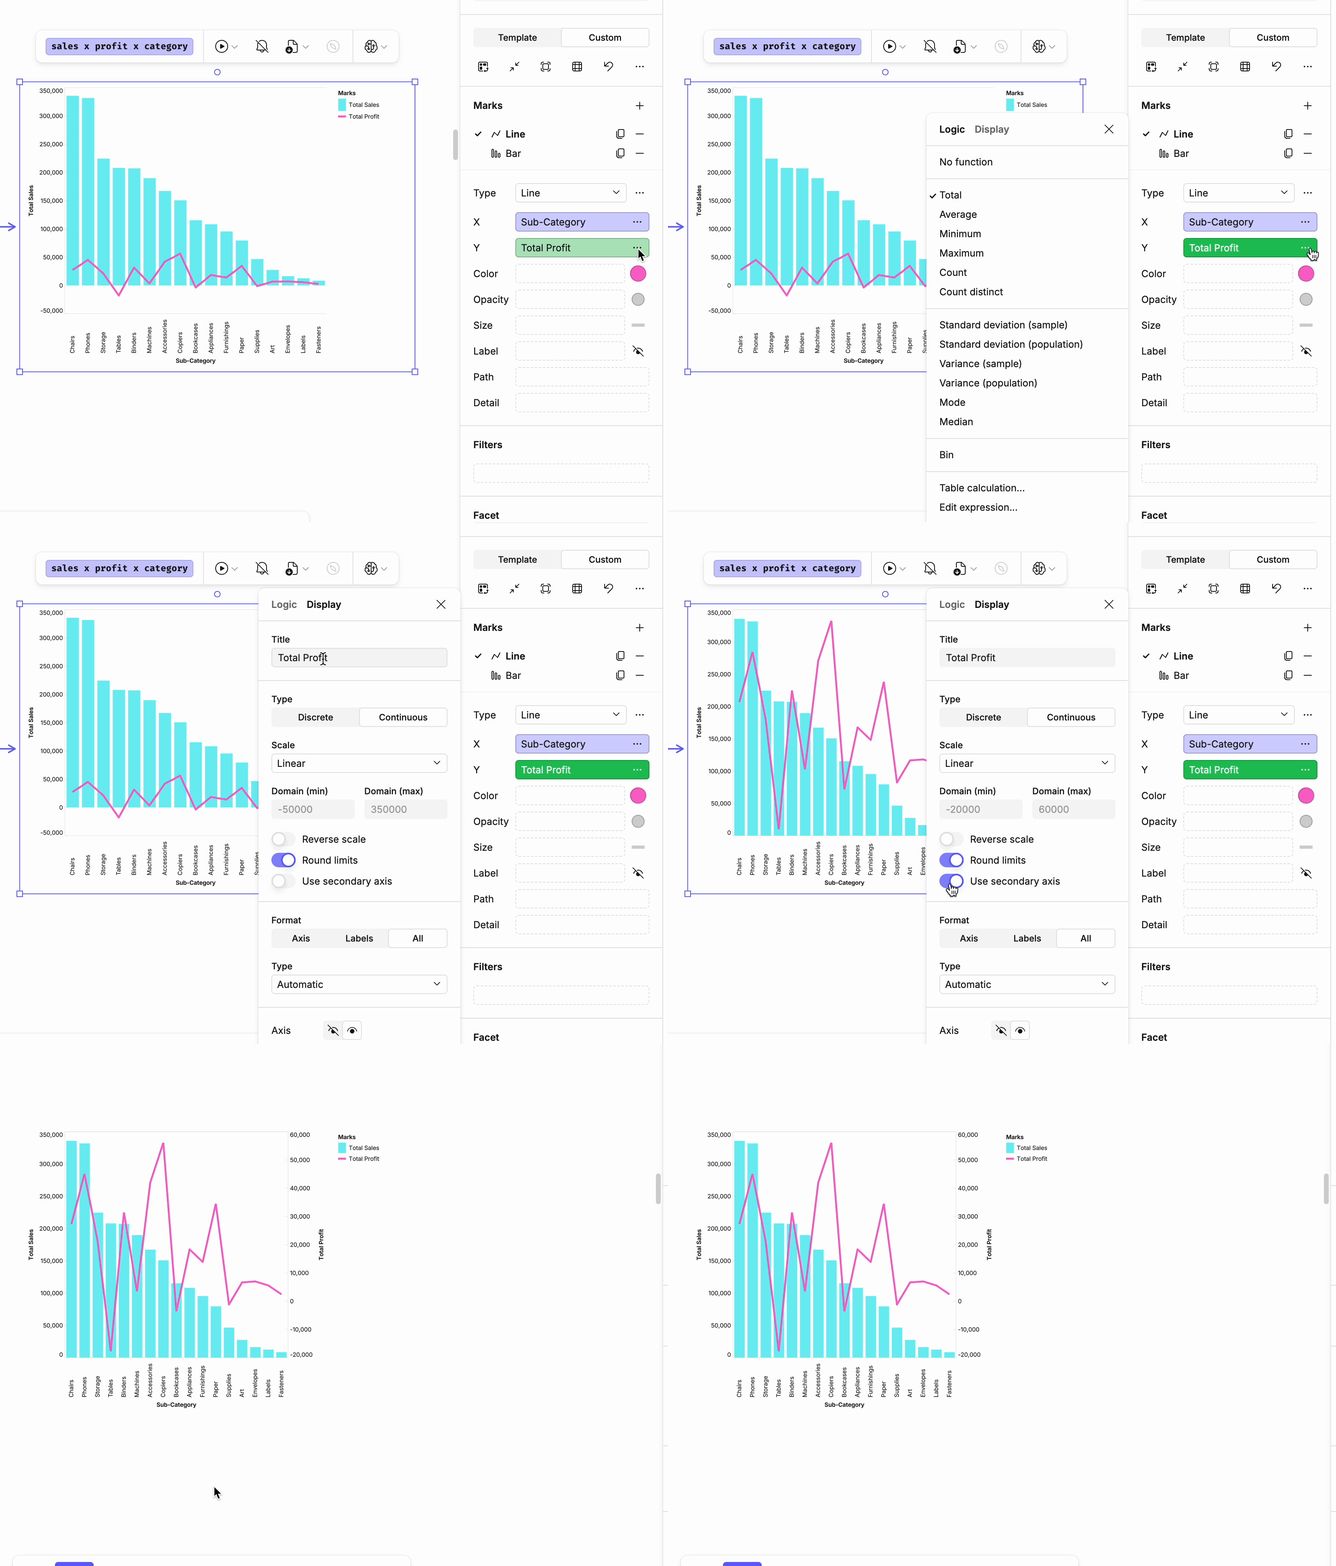
Adding a secondary axis
Click on the 3 dots by the axis you want to move
Click on the Display tab
Toggle on
Use secondary axis
Previous
Tooltips
Next
Layout and sizing
Last updated: 31/07/26
On this page
Adding a secondary axis