Totals and subtotals
Totals and subtotals add summary rows and columns to your visuals — giving you grand totals across the whole result, and subtotals at each level of a row or column hierarchy.
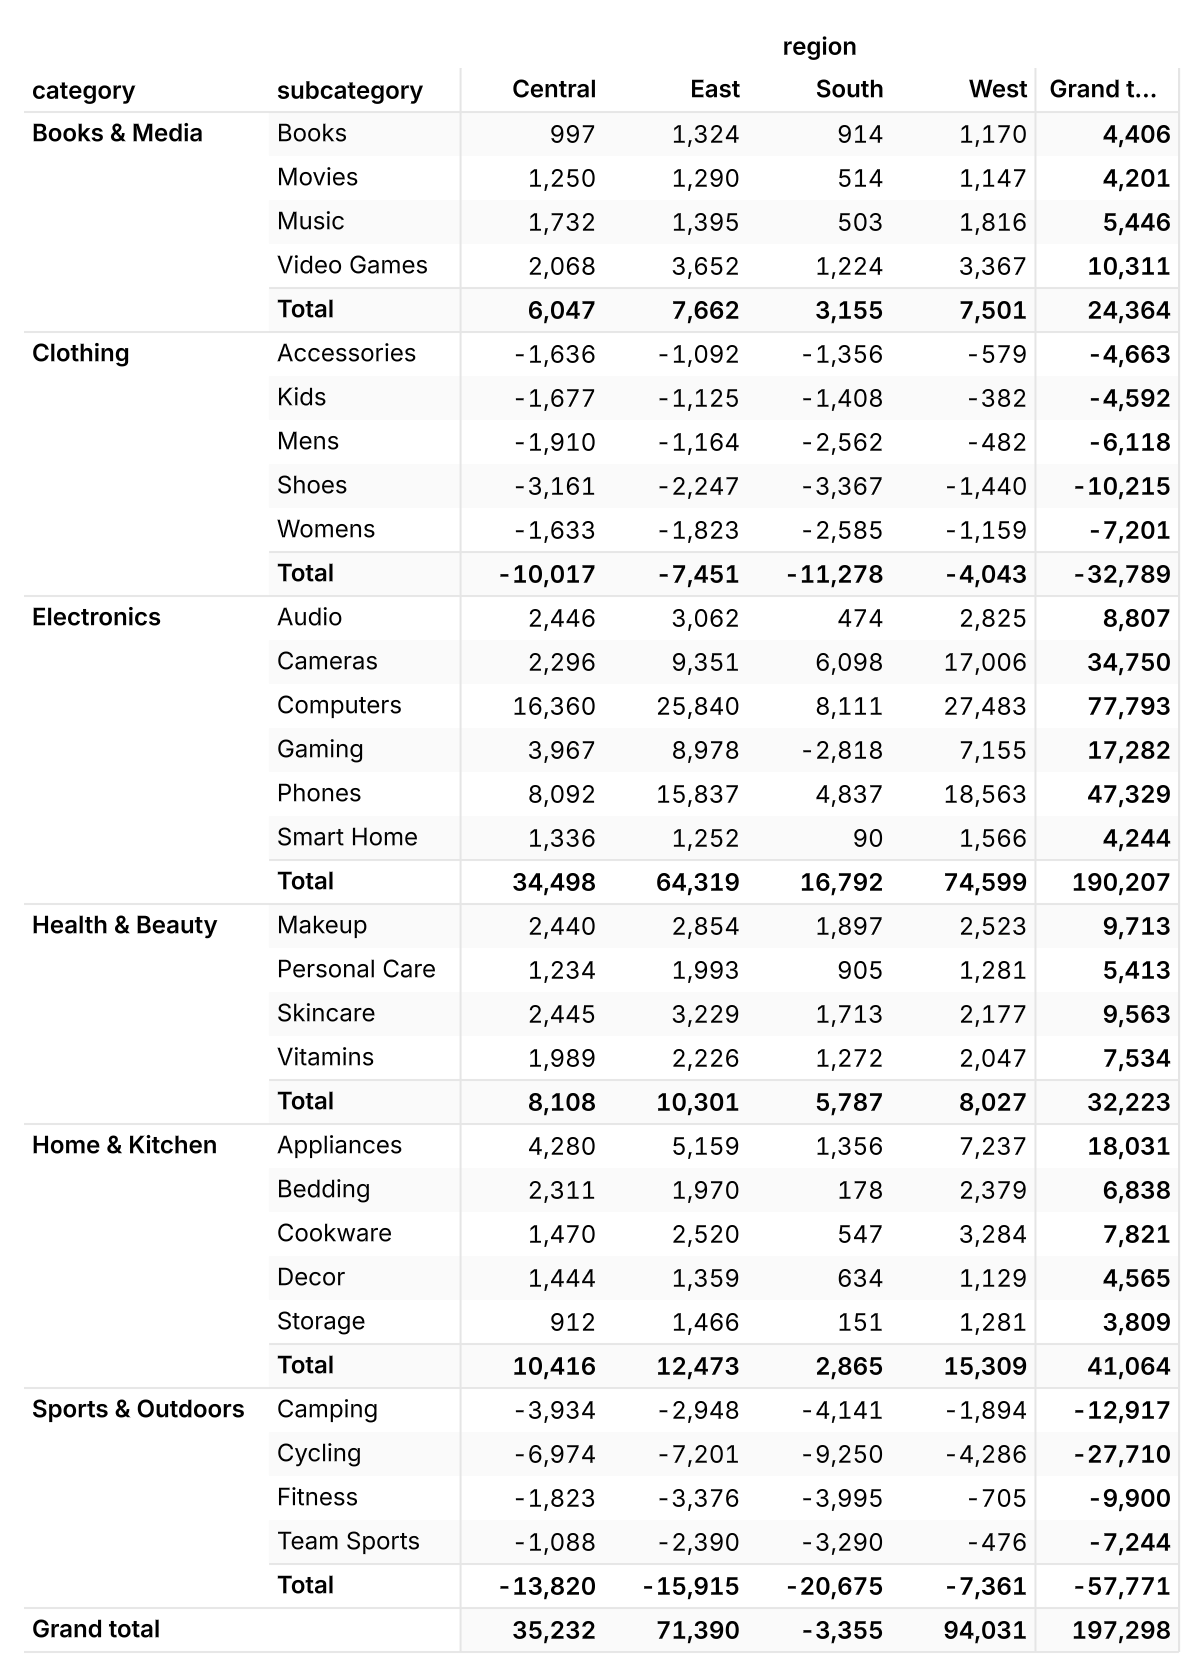
In Count, totals are recomputed from the underlying rows, not summed from the cells you can see. This means that non-additive aggregations such as averages, distinct counts, medians and percentiles produce a correct value at every level, not a misleading "sum of averages".
#Getting started
Totals are configured per-visual from the right-hand sidebar of any supported visual cell.
To turn totals on or off:
- Select the visual cell.
- Open the Visual options panel in the right sidebar.
- Find the Totals control.
- Click the eye icon to show or hide all totals at once.
#Options
The Totals control exposes four independent toggles. Rows and columns are configured separately, and grand totals are configured separately from subtotals.
- Rows → Grand Totals — a single column on the right aggregating across all columns.
- Rows → Totals — a subtotal column at every level above the leaf in a row hierarchy. For a hierarchy of Region → Country, you'll see a subtotal column for each region.
- Columns → Grand Totals — a single row at the bottom of the visual aggregating across all rows.
- Columns → Totals — the same behaviour on the column hierarchy.
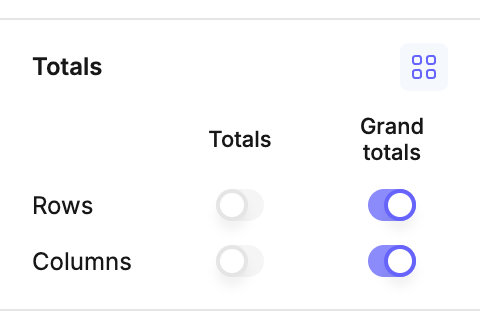
Subtotals only appear when the relevant axis has two or more hierarchy levels — there is nothing to "sub-total" when there is only one level on an axis.
#How totals are calculated
Totals and subtotals are recomputed from the underlying rows, not aggregated from the visible data in the cell.
This distinction matters most for non-additive aggregations:
- Averages show the true mean across all rows, not the mean of the displayed means.
- Distinct counts show the distinct count over the broader rollup, not the sum of child distinct counts.
- Sums, counts, mins, maxes, medians and percentiles behave the same way — each total is computed over the expanded row set.
Because totals are computed from rows, they reflect the same calculation you defined for the leaf cells — including calculations you've authored yourself.
Number formatting (currency, percentage, decimals) is inherited from each column. Filters on the visual still apply, so totals always agree with the rows shown.
#Supported visualisations
Totals are available on visuals where summary rows and columns are meaningful:
- Pivot tables
- Heatmaps
- All custom visuals
Visuals without a row/column structure (e.g. scatter plots, single-value KPI cards) do not show the Totals control.
#Notes
- Subtotals require ≥ 2 hierarchy levels on the axis they're displayed on. If you've only added one field to the row or column axis, only grand totals are available for that axis.
- Totals follow the aggregation defined on the measure. To change how a total is computed, change the measure's aggregation — there is no separate "totals aggregation" setting.
Last updated: 03/08/26